Graphics & Visualization
Create Nichols Plots
Create Nichols plots of magnitude vs. phase from transfer functions or models.
| In[1]:= | 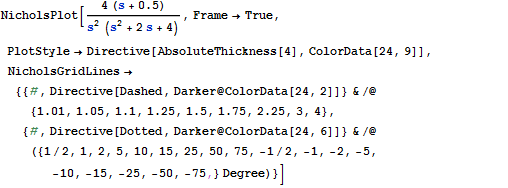 X |
| Out[1]= | 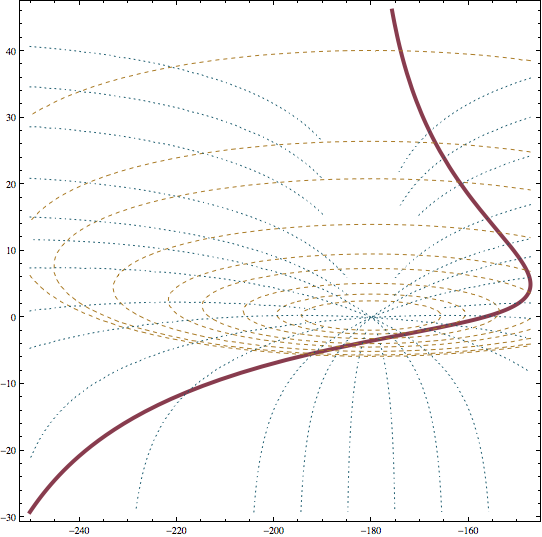 |
| New in Wolfram Mathematica 8: New and Improved Scientific and Information Visualization | ◄ previous | next ► |
| In[1]:= | X |
| Out[1]= | |