Graphics & Visualization
Visualize Wavelets with Scalograms
Plot a wavelet scalogram of the vector coefficients of discrete or continuous wavelet transforms of a dataset.
| In[1]:= | X |
| In[2]:= | X |
| In[3]:= |  X |
| Out[3]= | 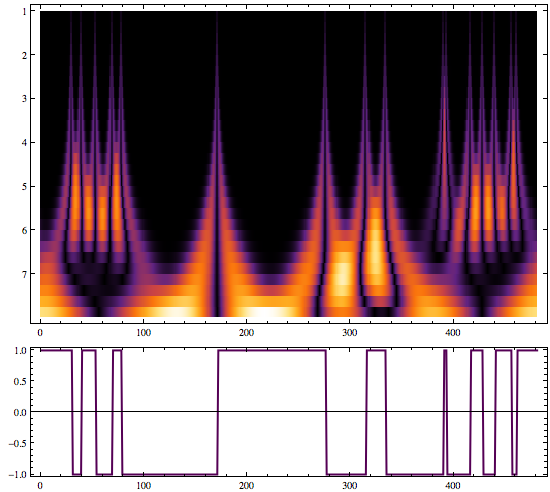 |
| New in Wolfram Mathematica 8: New and Improved Scientific and Information Visualization | ◄ previous | next ► |
| In[1]:= | X |
| In[2]:= | X |
| In[3]:= | X |
| Out[3]= | |